
Browser DevTools are great, until the thing you want to look at isn't a browser tab. An Electron app that won't tell you what it's calling. A CLI tool with a mysterious failure. A desktop client that "just stopped working". For those you need to watch the network from outside the app.
That's what a local intercepting proxy does: it sits between your applications and the internet, so everything passes through a place where you can see it. Here's how to set that up with Mittelware in a few minutes.
1. Switch it on#
Install Mittelware, open it, and flip the switch next to its name at the top of the sidebar. The status changes to Monitoring, with a green dot. By default it listens on 127.0.0.1:8080, which means only programs on your own computer can use it.
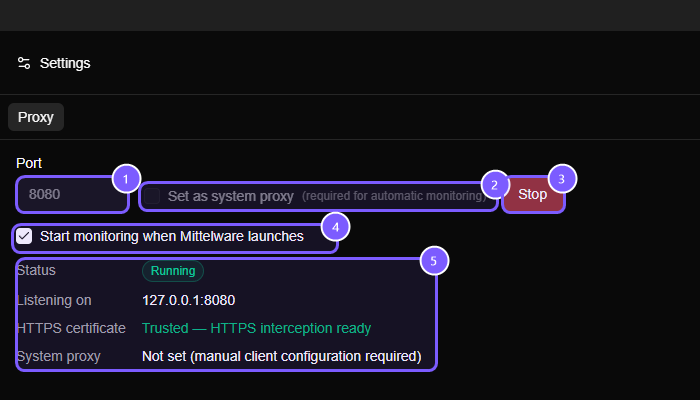
Turn on Set as system proxy under Settings → Proxy (it's off by default, and you change it while monitoring is off) and Mittelware also points your operating system's proxy at itself. Apps that follow the system setting then start showing up in Flows immediately. If you leave it off, step 3 shows how to send individual apps through Mittelware.
The Settings page confirms what's going on:
2. Decide about HTTPS#
Almost everything today is HTTPS, and encrypted traffic is unreadable by design. To show you the content, Mittelware creates its own certificate authority and asks you to trust it. That's the question you'll see the first time you start the proxy:
- Trust & Monitor HTTPS reads encrypted traffic. Your OS asks you to confirm installing the certificate.
- Monitor HTTP Only skips it. HTTPS requests pass through uninspected.
The trust is limited to your user account on this device, and the certificate and its key are generated locally and stay there. You can remove it at any time. The details are in HTTPS & certificates. When it worked, the HTTPS certificate line in Settings reads Trusted — HTTPS interception ready, as in the screenshot above.
3. Get an app's traffic flowing#
With the system proxy on, most apps follow it, so just use them. For apps that don't, or if you left the system proxy off, open the Applications page. Click a Chromium or Electron app (Chrome, Edge, VS Code, Postman, Slack and others) and Mittelware relaunches it with the proxy applied. For command-line tools it copies a ready-made command:
curl -x http://127.0.0.1:8080 https://api.github.com/zen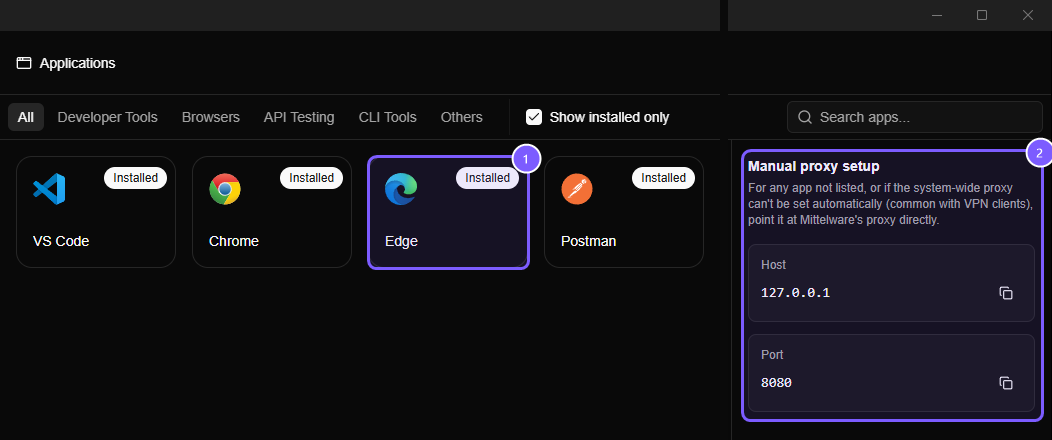
NOTE
Relaunching closes the app if it's already running, so save your work first.
4. Read a request#
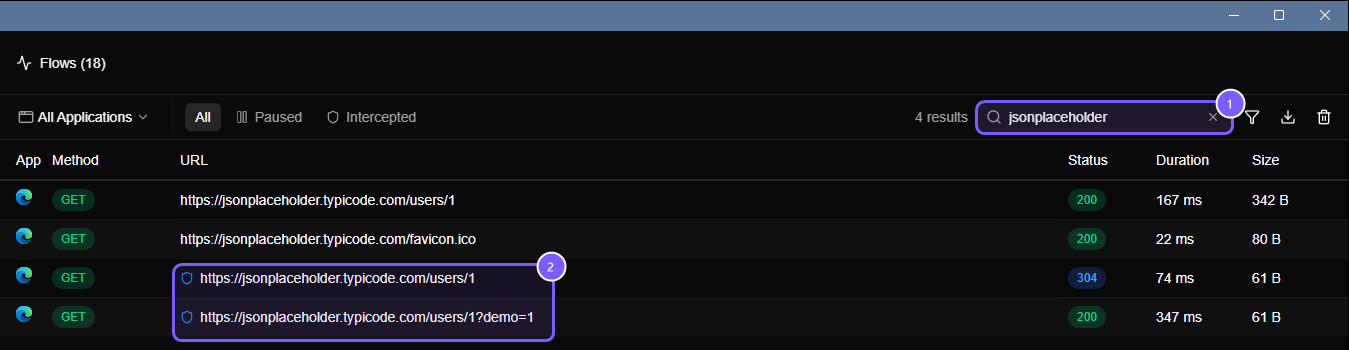
Switch to Flows. Each row is one request and its response, tagged with the application that made it.
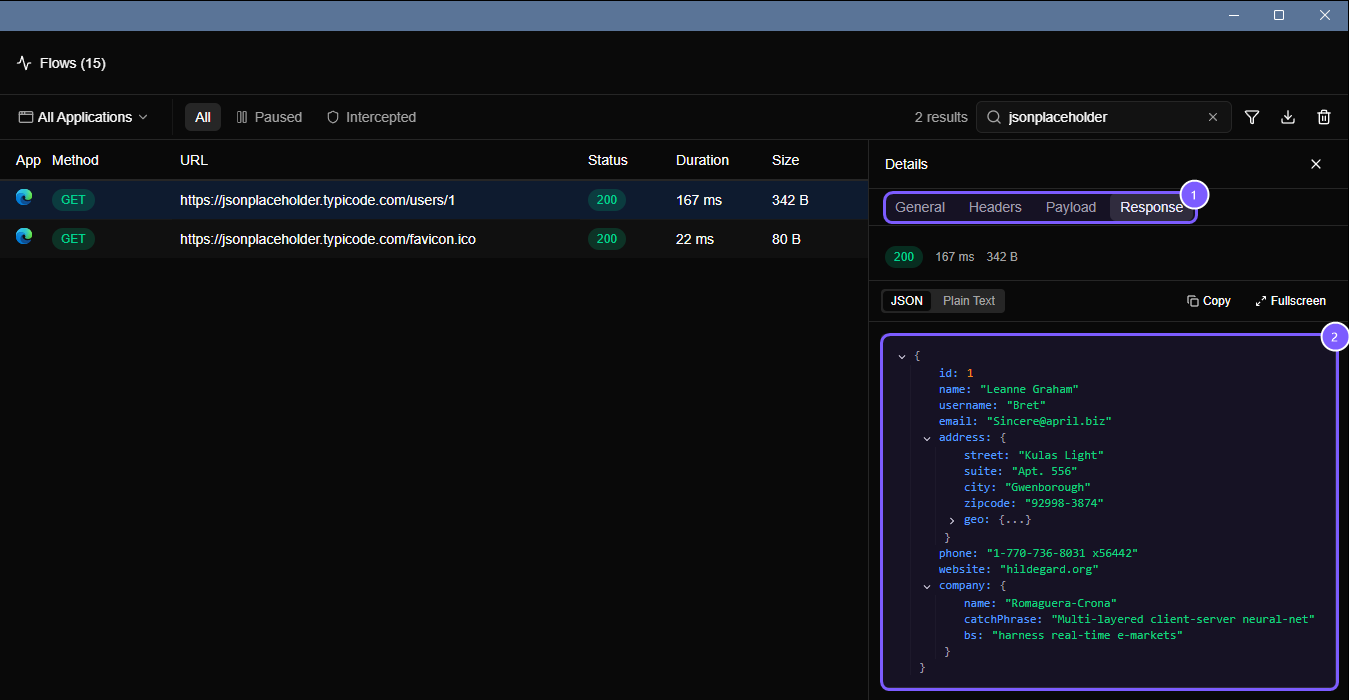
Click a row to see:
- General: method, full URL, status, timing and size.
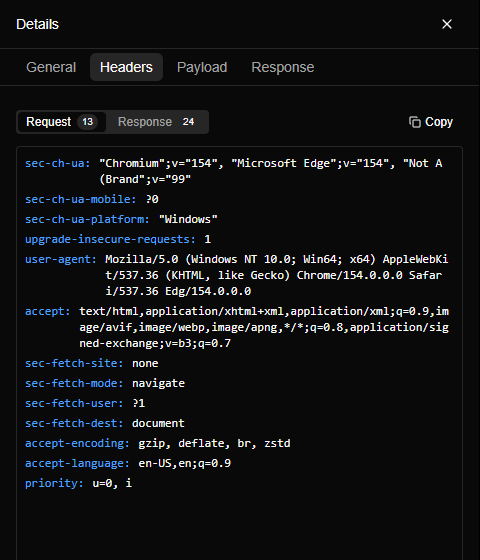
- Headers: everything sent and received. Check
Authorization,Cookie,Content-Typeand caching headers. - Payload: what the app sent, for
POSTandPUTrequests. - Response: the body, pretty-printed for JSON, XML and HTML, with a tree view for big documents.
The Headers tab is where authentication and caching problems show up. Request and response headers have separate tabs, each with a count:
5. Narrow it down#
A busy machine produces a lot of traffic. Cut it down:
- Use the application filter to show one app only.
- Type into the search box to match part of a URL.
- Use the Intercepted tab to show only requests your rules have acted on.
What you'll learn#
The first time you do this, you'll probably be surprised. Common discoveries:
- An app making dozens of calls on startup, some of them to services you didn't know about.
- A request that's sent twice, or retried silently.
- A response that's far bigger than the UI needs.
- A token or an ID in a URL where it shouldn't be.
- Latency that's in the server, not in your code. The timing column shows where the time went.
What you can't see#
Some traffic stays hidden, and it's useful to know why:
- Apps that pin their certificates refuse Mittelware's certificate, so their HTTPS can't be read.
- Apps that ignore the system proxy never send traffic to Mittelware unless you configure them directly.
- Bodies over 32 MB aren't captured. (Responses that arrive in pieces, such as
text/event-stream, are: they show up chunk by chunk in the Stream view.)
If something's missing, this checklist walks through the usual suspects.
Keep it private#
Captured traffic can contain tokens, cookies and personal data. Mittelware keeps it on your machine, but screenshots and copied requests are on you. Redact before you paste into a bug report.